After yesterday's fun with pretty graphs, I did some investigation into what the system was actually doing during my runs. I noticed a number of things.
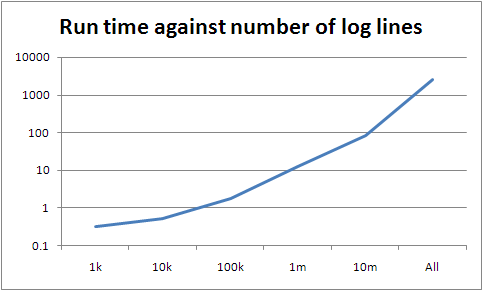
Before doing any of this, I did a run with the full set of data: 2492.9 seconds, or about 41 minutes. I was hoping for something in the range 35-45 minutes, based on a rough approximation, so as a first stab this isn't too bad. It's worth re-iterating though, that this is still an order of magnitude worse than the leading contenders, so the big question is whether this remains just an optimisation problem for me, or if there are other things impeding parallelism as well. Anyway, on to my observations.
- I was generally using each CPU about a third to half as much as is possible.
- My drive throughput was between 7M/s and 20M/s per drive. Presumably I'm processing somewhere in between, so we're seeing read-ahead buffering do its thing; however I'm still not able to keep the drives operating at a consistent throughput, let alone at their maximum, which is more than double that.
- I'm being very naive about resource usage at the moment.
- When I did a run over the complete 42G of data, I ended up having 42G of RSS.
- A parallel read of all the data, not even processing it, took 100 times as long as a parallel read of 10m lines
The first I've noticed during other people's runs as well. With me, it isn't in disk stalls, because I'm not seeing significant asvc_t against the two drives behind the ZFS volume. However the patterns of asvc_t against drive utilisation (%b in iostat -x) vary for different implementations. This all suggests to me that there are gains to be had by matching the implementation strategy more closely to the behaviour of the I/O system, which isn't really news, but might have more impact than I expected. Of course, for all I know, the best implementations are already doing this; it would be nice to know what about them is better, though, and whether it's applicable beyond this setup, this data, this problem.
Anyway, what do we get from this? That I've failed to observe my first rule in looking at any scaling problem: making sure we don't run out of memory.
Memory
If you use mmap to map a file larger than core, and then read through the entire file, you end up with the whole thing mapped into core. This doesn't work, of course, so you get slower and slower until you're swapping like crazy; this of course means you get process stalls, and the ever-helpful operating system starts doing more context switches. So the entire thing melts: it's fun. This is still true even if we split the file across multiple processes; elementary arithmetic should tell us that much, but hey, I went ahead and demonstrated it anyway, even if that's not what I meant to do.
So what I really should do instead is to do multiple runs of J processes at a time; enough runs that the total amount mapped at any one time will always be less than available memory. Another approach might be to munmap chunks as you go through them; I actually prefer that, but I don't think it's possible in Python.
I'm hoping this is why we suddenly go crazy between processing 10m lines and all of them.

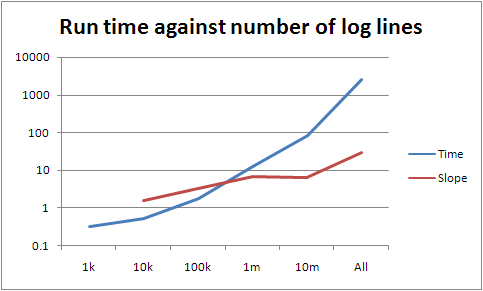
The slope between 100k and 10m is around seven; between 10m and the whole lot it's about 30. However the slopes lower down are a lot lower than seven, so there's something else going on if they're representative (they may be not simply because the data is too small). If they are, there's a pretty good fit curve, which is very bad news for the scalability of what I've written.

The obvious thing that is changing as we get bigger (beyond running out of memory) is the size of the partial result sets. These have to be serialised, transferred, unserialised, reduced, lost, found, recycled as firelighters, and finally filtered into an elite set. The bigger they are, the longer it takes, of course, but something much worse can go wrong with a map with many items: it can bust the assumptions of the underlying data structure. I don't think that's happening here, as we only have a few million entries in the largest map, but it's something that's worth paying attention to when thinking about scaling. (I have some thoughts related to this at some point, although you could just read Knuth and be done with it. Sorry, read Knuth and about five hundred papers since then and be done with it. Oh, and you have to know what data structures and algorithms are being used by your underlying platform.)
Anyway, today I've mostly been proving how much I suck. I have some other stuff coming up; I've gathered a fair amount of data, and am still doing so, but it's getting more fiddly to either analyse or to pull this stuff into graphs and charts, so that's it for today. Expect something in the next couple of days.