This is about Wide Finder 2; I'm trying to apply the technique I discussed earlier, where we aim for minimal changes in logic compared to the benchmark, and put as much of the parallelism into a library. I'm not the only person working in this fashion; I think Eric Wong's approach is to allow different data processors to use the same system (and it allows multiple different languages, pulling it all together using GNU make), and I'm sure there are others.
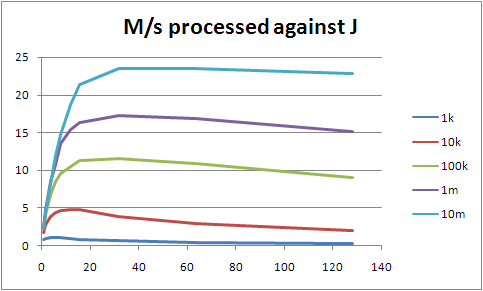
I don't have any full results yet, because I ran into problems with the 32 bit Python (and forgot that Solaris 10 comes with a 64 bit one handily hidden away, sigh). However I do have some pretty graphs. These are interesting anyway, so I thought I'd show them: they are timing runs for a spread of worker numbers between 1 and 128, working on 1k, 10k, 100k, 1m and 10m lines of sample data. The largest is about 1.9G, so it still happily fits within memory on the T2000, but this is somewhat irrelevant, because the fastest I'm processing data at the moment is around 20M/s, which is the Bonnie figure for byte-by-byte reads, not for block reads. We should be able to run at block speeds, so we're burning CPU heavily somewhere we don't need to.

At J=128, all the lines are trending up, so I stopped bothering to go any higher. Beyond the tiny cases, everything does best at J=32, so I'll largely concentrate on that from now on. Update: this is clearly not the right way of approaching it. Firstly, the fact that I'm not using the cores efficiently (shown by not hitting either maximum CPU use per process nor maximum I/O throughput from the disk system) means that I'm CPU bound not I/O bound, so of course using all the cores will give me better results. Secondly, Sean O'Rourke showed that reading from 24 points in the file rather than 32 performed better, and suggested that fewer still would be an improvement. So I need to deal with the speed problems that are preventing my actually using the maximum I/O throughput, and then start looking at optimal J. (Which doesn't mean that the rest of this entry is useless; it's just only interesting from a CPU-bound point of view, ie: not Wide Finder.)
You'll see that we seem to be scaling better than linearly. The following graph shows that more clearly.
The more we throw at it, the faster we process it. My bet is that ZFS takes a while to really get into the swing of things; the more you fire linear reads at it, the more it expects you to ask for more. At some point we'll stop gaining from that. Of course, that analysis is probably wrong given we shouldn't be I/O-bound at this point.

(Larger because it's fiddly to read otherwise.) Note that for each J line, from its inflection point upwards it's almost a straight line. It's not perfect, but we're not being hit by significant additional cost. None of this should really be a surprise; processing of a single logline is effectively constant time, with the same time no matter how many workers we have. The things that change as we increase either J or the total number of lines processed are the number and size of the partial result sets that we have to collapse, and other admin; but these differences seem to be being drowned out in the noise.
I'd say there's something I'm doing wrong, or vastly inefficiently, that's stopping us getting better use out of the cores on this machine. That's also more interesting than optimising the actual processing of the loglines.
Finally, the code. No commentary; this is really just Tim's version in Python, but using the parallel driver. I made the final sort stability independent of the underlying map implementation (Hash in Ruby, dict in Python), but that should be it; so far it's given me the same results, modulo the sorting change.
import re, sys, parallel

def top(dct, num=10):
    keys = []
    last = None
    def sorter(k1,k2):
        if k2==None:
            return 1
        diff = cmp(dct[k1], dct[k2])
        if diff==0:
            return cmp(k2,k1)
        else:
            return diff
    for key in dct.keys():
        if sorter(key, last)>0:
            keys.append(key)
            keys.sort(sorter)
            if len(keys)>num:
                keys = keys[1:]
            last = keys[0]
    keys.reverse()
    return keys

hit_re = re.compile(r'^/ongoing/When/\d\d\dx/\d\d\d\d/\d\d/\d\d/[^ .]+$')
ref_re = re.compile(r'^\"http://www.tbray.org/ongoing/')

def report(label, hash, shrink = False):
    print "Top %s:" % label
    if shrink:
        fmt = " %9.1fM: %s"
    else:
        fmt = " %10d: %s"
    for key in top(hash):
        if len(key) > 60:
            pkey = key[0:60] + "..."
        else:
            pkey = key
        if shrink:
            print fmt % (hash[key] / 1024.0 / 1024.0, pkey)
        else:
            print fmt % (hash[key], pkey)
    print

def processor(lines, driver):
    u_hits = driver.get_accumulator()
    u_bytes = driver.get_accumulator()
    s404s = driver.get_accumulator()
    clients = driver.get_accumulator()
    refs = driver.get_accumulator()

    def record(client, u, bytes, ref):
        u_bytes.acc(u, bytes)
        if hit_re.search(u):
            u_hits.acc(u, 1)
            clients.acc(client, 1)
            if ref !='"-"' and not ref_re.search(ref):
                refs.acc(ref[1:-1], 1) # lose the quotes

    for line in lines:
        f = line.split()
        if f[5]!='"GET':
            continue
        client, u, status, bytes, ref = f[0], f[6], f[8], f[9], f[10]
        # puts "u, #{u}, s, #{status}, b, #{bytes}, r, #{ref}"
        if status == '200':
            record(client, u, int(bytes), ref)
        elif status == '304':
            record(client, u, 0, ref)
        elif status == '404':
            s404s.acc(u, 1)
    return [u_hits, u_bytes, s404s, clients, refs]

(u_hits, u_bytes, s404s, clients, refs) = parallel.process(sys.argv[1], processor)

print "%i resources, %i 404s, %i clients\n" % (len(u_hits), len(s404s), len(clients))

report('URIs by hit', u_hits)
report('URIs by bytes', u_bytes, True)
report('404s', s404s)
report('client addresses', clients)
report('referrers', refs)
81 LOC, compared to Tim's 78, although that's disingenious to an extent because of the parallel module, and in particular the code I put in there that's equivalent to Hash#default in Ruby (although that itself is only three lines). Note however that you can drive the entire thing linearly by replacing the parallel.process line with about three, providing you've got the accumulator class (19 LOC). In complexity, I'd say it's the same as Tim's, though.